How Texture Analysis Improves Product Development in Food Manufacturing: Technologies and Applications
09-03-2023
Texture represents certain qualities in food that can be felt with the fingers, tongue, palate, and teeth. It is how a product feels when handled, whether squeezed or tapped at the point of sale, mixed or pressed during preparation, torn or grasped.
To ensure the food products meet the standards, manufacturers apply texture analysis in their R&D and Testing for new product development or quality control. Texture analysis can quantitatively determine the textural properties, which are more reliable and not reliant on individuals.
For example, scientists can choose whether to add new or alternate ingredients to improve the texture without modifying the taste of the original products. They can also use it to write instructions on how to cook the products to achieve the intended consistency, such as in cooking al-dente pasta. In agricultural settings, scientists can also conduct textural analysis on fresh products, such as fruit, vegetables, meat, and fish, to scientifically determine how the product is best grown or reared. Food manufacturers could also use it to compare their products with competitors.
Texture Analysis is basically the study of the deformation and flow of a food product when it is under the influence of stress. In general, from a sensory perspective, the texture of a food item is evaluated when it is chewed. The instrumental evaluation of texture is used to measure the response of food when it is subjected to simulatory forces such as cutting, shearing, chewing, compressing, or stretching.
For measuring food texture in different food products, fully automated universal testing equipment is used. The TA1 texture analyzer exerts a controlled load on the sample via moveable frames with customized jigs to hold the products. It objectively measures the mechanical characteristics of a food product in terms of force, distance, and time, which can be further used to interpret its textural properties.
For example, analyzing the characteristic curve to calculate the force or energy required to cut (penetrate), tear, or compress (deform). An operator just needs to select the required texture profile setting for a food sample from the vast library of food industry-standard tests offered by the data analysis software. It presents the analysis data in the form of various food properties such as adhesiveness, chewiness, hardness, springiness, resilience, gumminess, and other properties.

Fig 1: TA1 Texture Analyser with demonstrations using different fixtures
The arm of the texture analyzer contains the load cell, which moves in either an up or down direction at a defined rate of speed in order to compress or extend the food sample. The analyzer deforms the sample to either a defined distance or a percent change in height while continuously recording the force load acting on the food sample. The travel beam then returns to the start position and during this time, the force load response of the sample is continuously monitored by the software during the upstroke. The results are generally measured from a two-cycle texture profile analysis test.
The TA1 texture analyzer is generally available with a wide range of probes and fixtures that can be attached to its base or arm. Depending upon the chosen probe/fixture, the analyzer can perform several tests such as compression, extension, cutting, extruding, bending, and shearing. For instance, to imitate the incisor teeth shearing action, a set of fixtures comprising upper and lower “teeth” are used. The sample is positioned on the lower “tooth,” and the result is measured as the peak force required to bite through the sample. Similarly, in order to perform a compression test on a food sample, a cylindrical probe can be used to apply force on the sample. In this case, the tenderness of the food sample is measured as the force or energy required to deform the sample. It basically simulates the biting action in the mouth by replicating the effects of two bites of food samples such as meat patties.
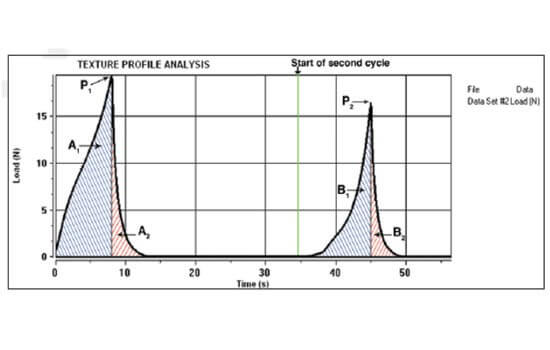
Fig 2a: Texture Profile Curve in terms of Load and Time
During texture measurement, the result data is controlled via the data analysis software which allows operators to monitor the force, distance, and time during the entire simulation process and calculate critical texture parameters. The above graphical representations generated by the software provide insight into the response generated by applying controlled forces in the form of force, deformation, and time. The force vs time graph (Fig 2a) depicts the force peak resulting from each compression cycle. This peak value represents the force at which a food sample would break upon compressing, shearing, or stretching it. With this data, the force required to attain a certain deformation is calculated, which further provides the desired texture profile of the food sample.
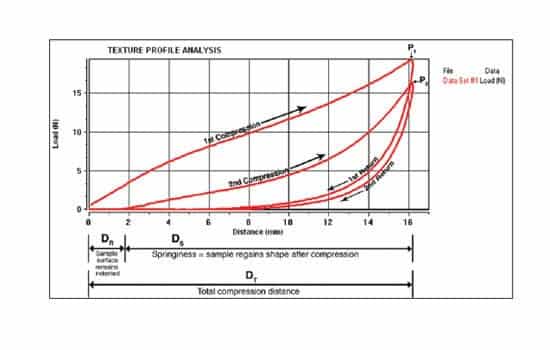
Fig 2b: Texture Profile Curve in terms of Load and Distance
The load-distance curve (Fig 2b) displays the response of the sample to the application and removal of strain. It depicts the increase in the load exerted while compressing or stretching a food sample and the decrease in load as the sample returns to its original form.
The analyzer generally features a sizable working area to accommodate large samples and can be fitted with a wide range of specially engineered food texture fixtures and probes as well as multipurpose grips. The size of the specimen can be selected based on the homogeneity of the sample. Food with large voids will require a larger sample size than food without voids to attain similar repeatability. Moreover, the choice of fixtures depends on the sample; for a sample with a flat surface, compression plates that are larger than the sample are used. For surfaces that are uneven, such as fruit and vegetables, small-diameter probes are used.
Texture analyzers are suitable for testing various food products. Jigs and fixtures are selected based on the textural requirement of the food item. For instance, for solid foods, the sensory experience associated with fracture and breaking could be the most relevant textural feature, whereas the sensation of flow could be a critical textural feature for fluid foods. Similarly, for semi-solid or soft solid food products, different patterns of stress deformation provide key information about the texture variation among this type of food. See below for examples of food texture analysis in the industry:
Adapting Texture Analysers in food research and production operations provides the manufacturers and researchers control of what is objectively quantifiable. It ensures that their unique selling point remains consistent in the face of external variables. Moreover, a food product probably won’t get a chance to be tasted, if it doesn’t provide the satisfaction of an ideal texture.
Would you like more information from one of our experts?
Contact us for discussionError: Contact form not found.
© Copyright Bestech Australia. All Rights Reserved. | Legal Statement